



Resumes
August 13, 2026


.webp)
A strong Tableau resume should show what your dashboards and analysis changed, not only that you built them. Highlight the number of users and workbooks you support, adoption and usage rates, reporting cycles cut, load time improvements, analyses that changed a decision and what they were worth, and for administrators the availability, migrations, and cost results. Name your certifications and stack, because Tableau credentials, SQL, and the warehouse you connect to are filtered on. State your role plainly, since a Tableau analyst building dashboards, a fresher with a public portfolio, a data analyst using Tableau to find answers, a developer engineering enterprise and embedded analytics, a business analyst owning requirements and metric definitions, and an administrator running the platform are hired on different evidence. Use the examples below to see how to turn Tableau work into clear, results-focused resume achievements.
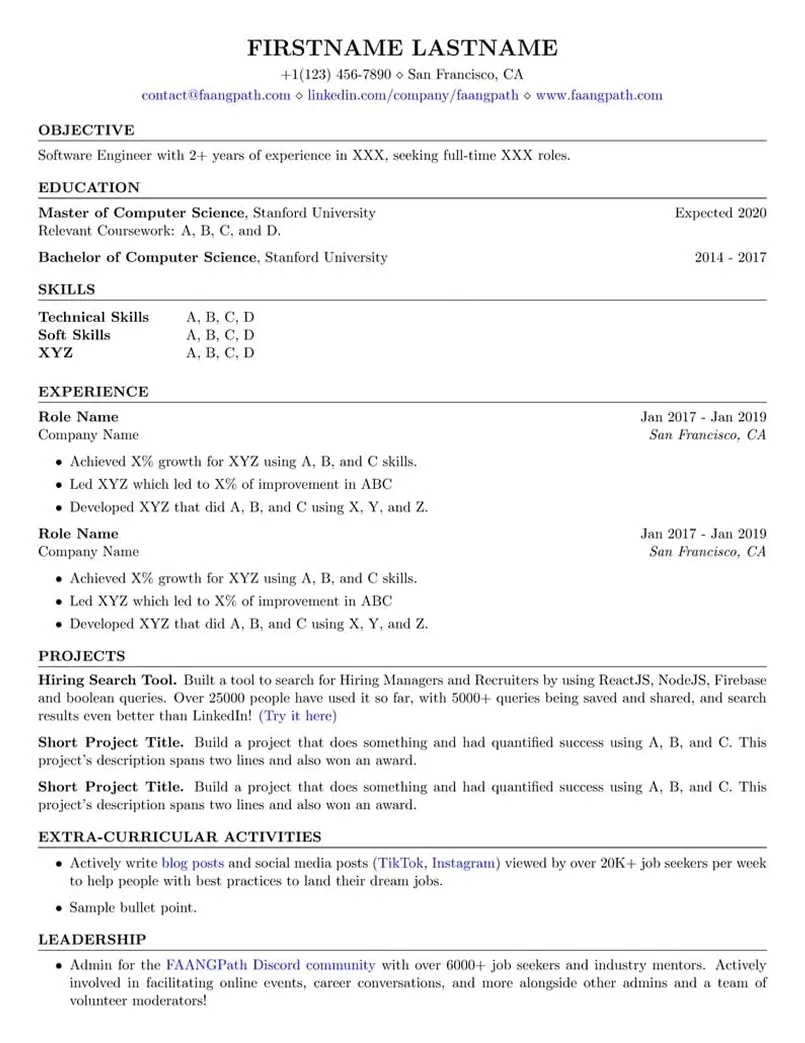
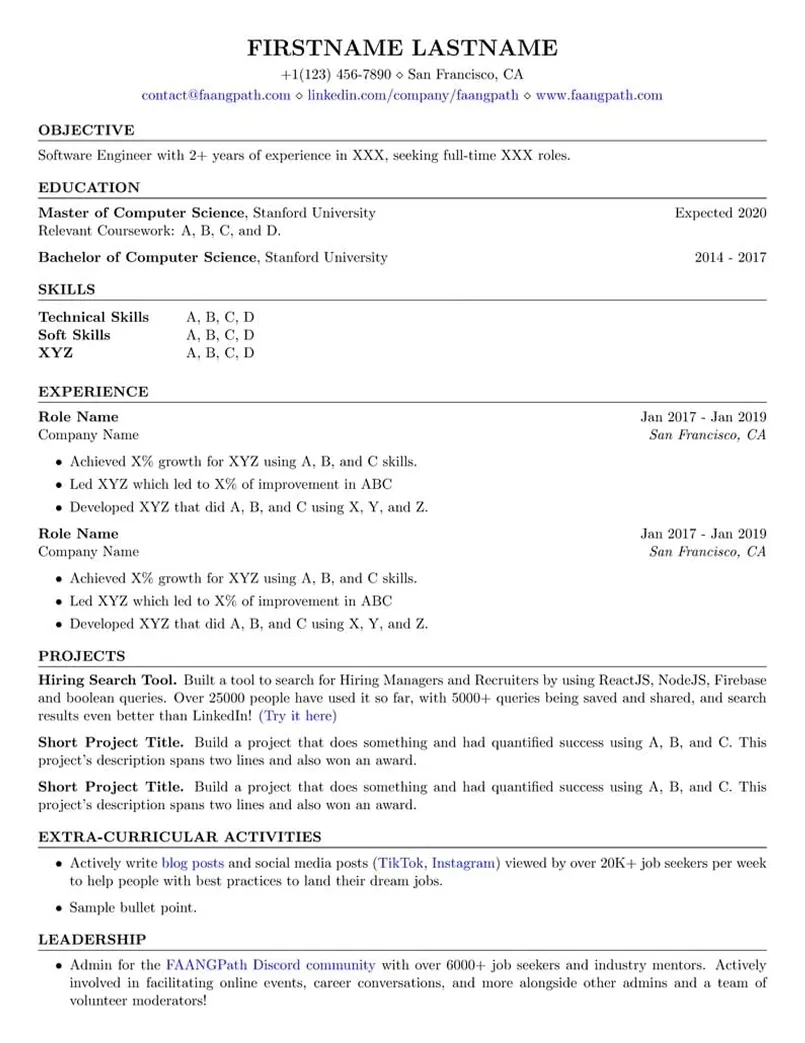
Meet Arjun Nair, a fictional senior Tableau analyst building a dashboard suite for 4,200 users across 30 clinics. This example shows the core Tableau role measured on reporting cycles cut, reports retired, and adoption raised.
(872) 555-0145 ◇ Chicago, IL
arjun.nair@example.com ◇ linkedin.com/in/arjun-nair ◇ arjunnair.com
Tableau professional with 6 years building dashboards and analytics for a healthcare services company with 4,200 users across 30 clinics. Built the executive and operations dashboard suite of 45 workbooks used by 900 people a week, cut the monthly performance reporting cycle from 10 days to 1, and retired 120 manual spreadsheet reports. Builds dashboards that answer the question the business is actually asking, and then measures whether anyone uses them.
Coursework in Data Visualisation, Database Systems, Business Analytics, and Statistics.
Tableau Desktop Specialist since 2020; also completed a healthcare analytics certificate in 2023.
Clinic Operations Dashboard Suite. Ran requirements sessions with 30 clinic managers, defined 60 metrics with owners, and built 12 governed dashboards over published data sources covering volume, wait times, staffing, and revenue, which replaced 120 spreadsheet reports and cut the monthly reporting cycle from 10 days to 1.
Adoption Programme. Analysed server usage data to find 15 workbooks with under 10 monthly viewers, interviewed their intended users, and redesigned or retired each, alongside 20 training sessions for 400 users, which raised adoption from 31% to 78% of target users in 9 months.
Claims Leakage Dashboard. Built a dashboard at a previous employer comparing paid claims against policy terms and duplicate patterns across 400,000 claims a year, with drill-down to claim level for the recovery team, which identified $3.2M in recoverable overpayments in the first year.
Meet Pooja Iyer, a business analytics graduate with a Tableau certification, an analytics internship, and a public portfolio of 24 dashboards. This example shows how to write a first Tableau resume on work that can be opened and inspected.
(848) 555-0112 ◇ Edison, NJ
pooja.iyer@example.com ◇ linkedin.com/in/pooja-iyer ◇ poojaiyer.com
Business analytics graduate seeking a first Tableau role, holding the Tableau Desktop Specialist certification, a 6-month analytics internship, and a public portfolio of 24 dashboards. Built 9 dashboards during the internship that are still in use by a sales team of 40, won a university visualisation competition of 30 entries, and has 3 public dashboards with more than 5,000 views each. No permanent analyst title yet, so the work shown is work that can be opened and inspected.
GPA 3.8; coursework in Data Visualisation, Database Management, Statistics, Predictive Analytics, and Business Intelligence.
Also completed a SQL for data analysis certificate and a 40-hour Tableau advanced course in 2026.
Sales Pipeline Dashboard. Built a pipeline dashboard during the internship over a live connection to the sales system, with stage conversion, ageing, and rep-level drill-down, iterated across 4 rounds of feedback from 6 managers, which replaced a 6-hour weekly report and is opened by about 30 of 40 reps each week.
Public Portfolio. Published 24 dashboards on public data covering transit ridership, housing costs, and sports statistics, with 3 exceeding 5,000 views and 1 selected as a community featured visualisation, which is the body of work reviewed in every interview so far.
University Retention Analysis. Combined 5 years of enrolment data across 40,000 student records, built a retention dashboard by programme and cohort, and identified 3 programmes with first-year retention 15 points below the average, which won a university visualisation competition of 30 entries and led to an advising pilot in 1 programme.
Meet Colette Beaumont, a senior data analyst using Tableau to drive merchandising decisions at a 220-store retailer. This example shows analysis evidence: decisions changed, a markdown analysis worth $6.8M, and self-service data sources.
(763) 555-0150 ◇ Minneapolis, MN
colette.beaumont@example.com ◇ linkedin.com/in/colette-beaumont ◇ colettebeaumont.com
Tableau data analyst with 5 years in retail analytics, using Tableau as the primary tool for analysis that changes merchandising and marketing decisions at a retailer with 220 stores and $1.4B in revenue. Delivered 30 analyses in 3 years that were acted on, including a markdown analysis worth $6.8M in recovered margin, and built the self-service data sources that 200 analysts and managers query directly. Uses Tableau to find the answer, not only to display it.
Coursework in Statistical Methods, Regression, Experimental Design, Data Visualisation, and Programming for Data Analysis.
Also completed a retail analytics certificate and a causal inference course in 2024.
Markdown Timing Analysis. Analysed 3 years of markdowns across 8,000 products in Tableau, modelling sell-through curves by category and finding that first markdowns were taken an average of 3 weeks too early in 5 categories, which led to a revised markdown calendar worth $6.8M in recovered margin in its first year.
Self-Service Data Sources. Designed 14 published data sources with certified metric definitions, row-level security by region, and documentation, then trained 200 users to query them directly, which cut ad hoc requests to the analytics team 60% and produced 350 user-built workbooks in 18 months.
Promotion Profitability Analysis. Built a promotion analysis in Tableau at a previous employer combining sales lift, margin, and cannibalisation across 400 campaigns a year, which found 30% of promotions lost margin and supported a 22% reduction in unprofitable promotions worth $2.1M a year.
Meet Farhan Siddiqui, a senior Tableau developer building enterprise and embedded analytics for 9,000 users and 400 customers. This example shows the engineering side: an embedded product, load times cut, and a tested semantic layer.
(214) 555-0199 ◇ Dallas, TX
farhan.siddiqui@example.com ◇ linkedin.com/in/farhan-siddiqui ◇ farhansiddiqui.com
Tableau developer with 7 years building enterprise dashboards and embedded analytics for a logistics company with 9,000 users and 60 customer-facing analytics deployments. Built the embedded analytics product that 400 customers use through the company portal, cut average dashboard load time across 120 workbooks from 14 seconds to 2, and delivered a semantic layer of 30 certified data sources that every dashboard is built on. Treats Tableau development as software engineering, with standards, testing, and performance budgets.
Coursework in Databases, Software Engineering, Data Structures, and Web Development.
Tableau Certified Data Analyst since 2021; Snowflake SnowPro Core certification since 2022.
Embedded Customer Analytics. Built an embedded analytics product in the customer portal using the Embedding API, with row-level security across 400 customers, 12 dashboard templates, and single sign-on, tested against 50 pilot customers before rollout, which reached 6,000 monthly customer users and became a named feature in 30% of contract renewals.
Performance Programme. Profiled all 120 workbooks with performance recording, redesigned extracts to aggregate at query grain, refactored 400 calculations, and set a 3-second load budget enforced in review, which cut average load time from 14 seconds to 2 and cut server compute cost 35%.
Semantic Layer and Testing. Designed 30 certified published data sources with dbt models beneath them and an automated test suite through the REST API that checks every workbook after each refresh, which removed metric conflicts across departments and catches about 3 broken workbooks a month before users see them.
Meet Petra Havlickova, a senior business analyst owning analytics requirements and metric definitions at a 5-plant manufacturer. This example shows how a business analyst is measured, on first-review acceptance, metrics defined, and a scorecard used every week.
(216) 555-0160 ◇ Cleveland, OH
petra.havlickova@example.com ◇ linkedin.com/in/petra-havlickova ◇ petrahavlickova.com
Tableau business analyst with 6 years translating business questions into analytics for a manufacturing company with 5 plants and $900M in revenue, sitting between plant leadership and the data team. Gathered requirements for 70 dashboards with 92% accepted at first review, built the plant performance scorecard used in every weekly operations meeting, and led the definition of 120 enterprise metrics that ended 3 years of conflicting numbers. Makes sure the dashboard answers the business question, and that everyone means the same thing by the number.
Coursework in Business Intelligence, Requirements Analysis, Operations Management, and Statistics.
Tableau Certified Data Analyst since 2022; Tableau Desktop Specialist since 2020.
Enterprise Metric Definitions. Ran 24 workshops with plant and corporate leaders to define 120 metrics with a single formula, owner, and source for each, documented in a metrics dictionary tied to certified Tableau data sources, which ended 3 years of conflicting plant and corporate numbers and cut reconciliation meetings from weekly to none.
Analytics Requirements Standard. Built a requirements template with the business question, decision it supports, metric definitions, a Tableau prototype, and acceptance criteria, applied to 70 dashboards, which raised first-review acceptance from 65% to 92% and cut average delivery time from 7 weeks to 4.
Plant Performance Scorecard. Designed and built a plant scorecard in Tableau at a previous employer covering 30 metrics across safety, quality, delivery, and cost with drill-down to line level, adopted in every weekly operations meeting across 3 plants and credited by the operations director with a 12% improvement in on-time delivery through visibility alone.
Meet Gregor Mackenzie, a senior Tableau administrator running a platform for 12,000 users at a university system. This example shows administration evidence: availability, a Server to Cloud migration with 0 broken workbooks, and licence cost cut.
(970) 555-0170 ◇ Fort Collins, CO
gregor.mackenzie@example.com ◇ linkedin.com/in/gregor-mackenzie ◇ gregormackenzie.com
Tableau administrator with 8 years running Tableau Server and Cloud environments, currently administering a deployment for 12,000 users, 3,400 workbooks, and 900 published data sources at a university system. Holds 99.95% platform availability across 3 years, migrated the environment from Server to Cloud with 0 broken workbooks at cutover, and cut licence cost 28% through usage-based reclamation. Keeps the platform fast, secure, and governed, so that the analysts on it never have to think about it.
Coursework in Systems Administration, Databases, Networking, and Information Security.
Also holds AWS Certified SysOps Administrator Associate and completed a Linux administration course in 2019.
Server to Cloud Migration. Planned and ran a 9-month migration of 3,400 workbooks and 900 data sources with an automated inventory through the REST API, a compatibility test of every workbook, Bridge deployment for 40 on-premises sources, and a campus-by-campus cutover, which landed with 0 broken workbooks and 4 hours of planned downtime.
Licence Reclamation Programme. Built a usage report over 12 months of login and view data, defined a 90-day inactivity rule with a 2-notice reclamation, and automated it through the REST API, which reclaimed 2,100 licences, cut cost 28%, and funded the analytics training programme from the savings.
Content Governance Framework. Designed a 3-tier project structure with sandbox, departmental, and certified tiers, a certification checklist, and an automated archive of content unused for 180 days, which cut total workbooks from 5,800 to 3,400 while raising certified content views 60%.
Sign up now to access Careerflow’s powerful suite of AI tools and take the first step toward landing your dream job.

.webp)


%20Which%20Should%20You%20Use.webp)